In the wake of a three-week trial challenging the legality of its admissions process, Harvard College’s student body is under close scrutiny from lawyers, academics, and aspiring applicants alike.
As confidential University files and internal emails came to light throughout the litigation, plaintiffs pointed attention to advantages conveyed on applicants with wealthy, well-connected families. Donor affiliation and a spot on the secretive “Dean’s Interest List” can boost admissions prospects, according to files unearthed in court. At least 10 percent of the Class of 2019 was on such a list, and admissions rates for its members has historically been over 40 percent.
This year’s Harvard freshmen — like those who came before them — are an exceedingly well-off group relative to the country at large. More than 27 percent of members of the Class of 2023 who answered a question about parental income in a recent Crimson survey said their families make $250,000 or more per year — earnings higher than 95 percent of American households.
While Harvard continues to await a ruling in the federal lawsuit alleging it illegally discriminates against Asian American applicants based on their race, more Asian American freshmen stepped through the gates of Harvard Yard on Aug. 27 than any time in the University’s history. Whether the University or Students for Fair Admissions — the anti-affirmative action group acting as plaintiff — wins the case, the verdict will almost certainly be appealed.
As freshmen settled into their dorms and adjusted to their new lives in Cambridge, roughly 55 percent of them responded to a Crimson email questionnaire about their backgrounds, beliefs, and lifestyles. The anonymous survey explores topics ranging from political ideology to alcohol consumption to perspectives on current campus controversies. Of 1,666 students comprising the Class of 2023, 919 freshmen responded. The Crimson did not account for potential selection bias in its analysis of the results. Due to rounding, reported statistics may not total exactly 100 percent.
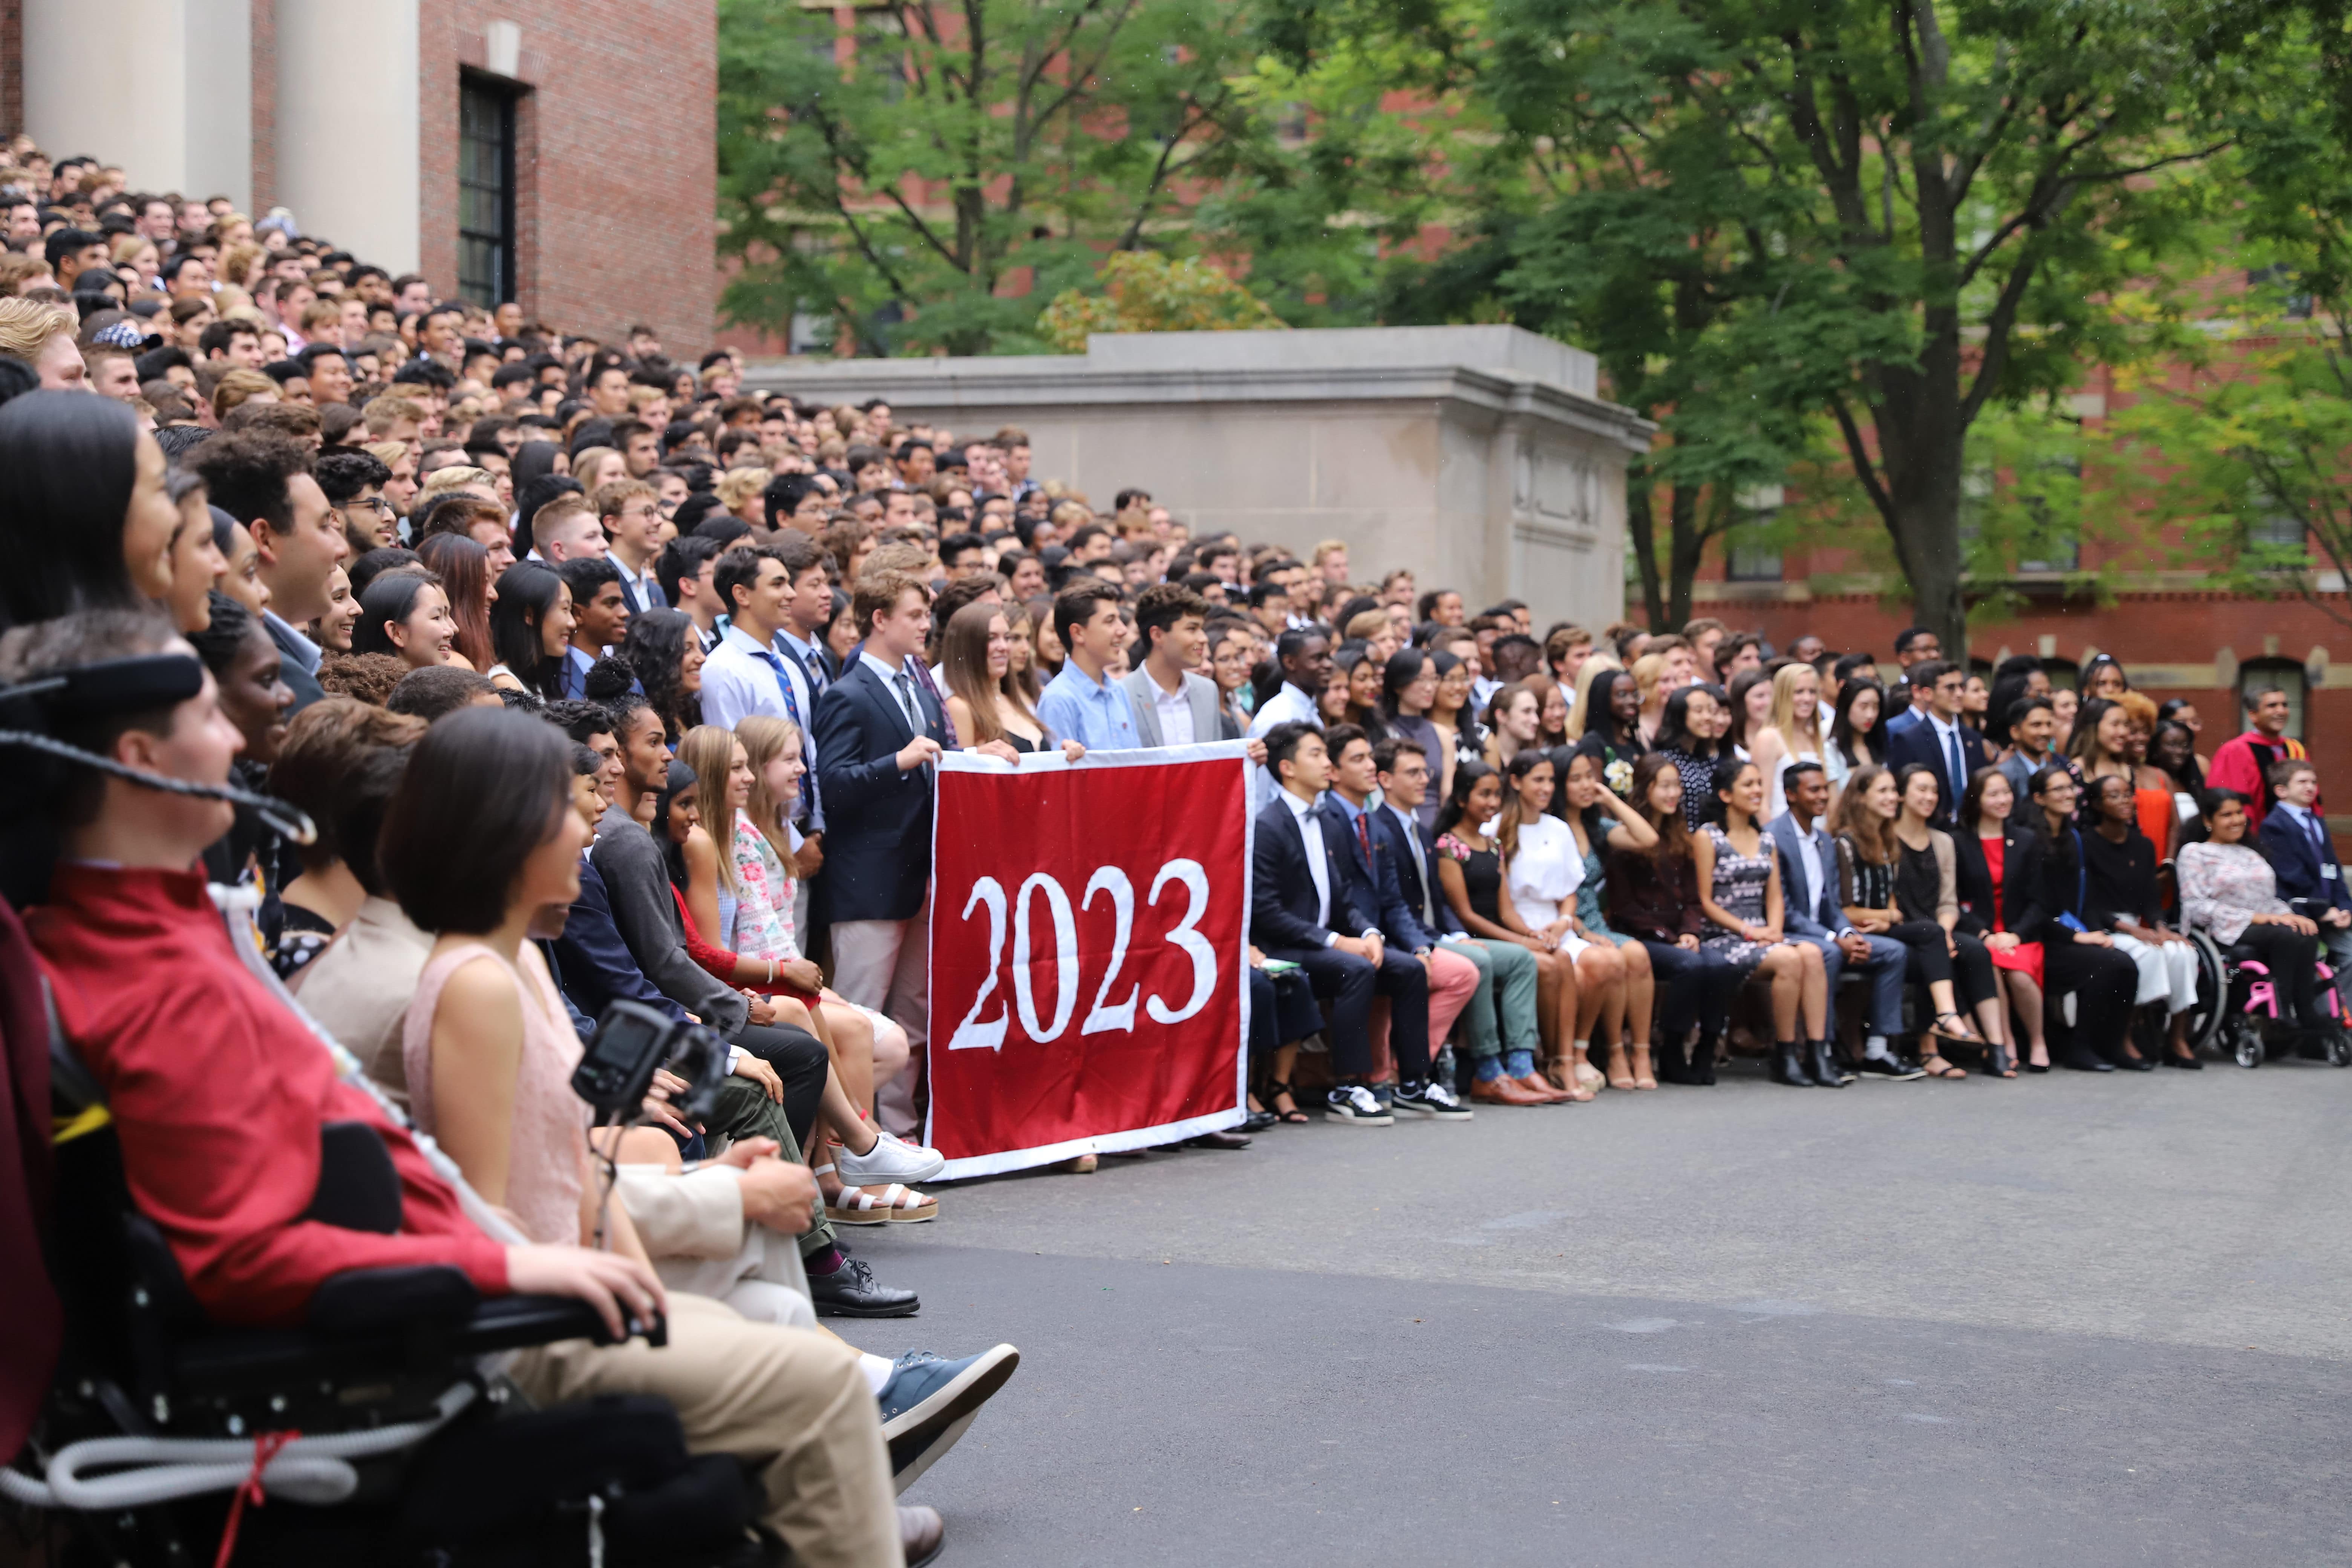
The opening segment of The Crimson’s three-part introduction to the Class of 2023 takes a close look at the demographic profile of this year’s College freshmen, analyzing the interplay of factors like gender, ethnicity, and socioeconomic status.
Demographics
Class of 2023
As has been typical for entering Harvard classes, this year’s freshman matriculants are predominantly white, wealthy, straight, suburban, and from coastal areas of the country.
Of students who responded to The Crimson’s survey, roughly 52 percent identified as female, 48 percent as male, and 0.2 percent as non-binary. Separately, approximately 0.2 percent identified as being transgender.
- Among participants who answered a question about ethnicity, 47.2 percent identified as white, 22.6 percent as Asian, 11.1 percent as Hispanic or Latinx, 10.1 percent as Black or African American, 5.8 percent as South Asian, 1.2 percent as American Indian or Alaska Native, and 0.8 percent as Pacific Islander.
- 76.2 percent of surveyed freshmen were 18 years old on the first day of classes last week. 11 percent were 17 or younger, 10.2 percent were 19, 1.7 percent were 20, and 0.9 percent were 21 or older.
- Of those who responded to a question about sexual orientation, 79.4 percent indicated they identify as straight, 7.2 percent as bisexual, 5.1 percent as gay or lesbian, and 1.7 percent as some other sexual identity. Roughly 4.8 percent of students said they are questioning their sexuality.
As in past years, a majority of surveyed members of the Class of 2023 come from the east or west coasts of the United States — 40.3 percent hail from the Northeast and 14.8 percent from the West. Meanwhile, 13.2 percent come from the Midwest, 10.5 percent from the Southeast, and a meager 6.4 percent from the southwestern states of Arizona, New Mexico, Texas, and Oklahoma.
- The distribution of students who report coming from urban, suburban, and rural communities remained roughly consistent with last year’s group. About 10.1 percent of surveyed freshmen said they come from rural communities, while a majority — 58.9 percent — indicated suburban origins. The remaining 30 percent of these students came to Cambridge from urban areas.
- 14.5 percent of respondents said they come from another country, marking an increase over the roughly 12 percent who reported international residency last year.
Mouse over region to see data.
40.3%
of students are from the Northeast.
71.9%
of students plan to live there after college.
36.4%
of students from the Northeast have a relative that went to Harvard College.
10.5%
of students are from the Southeast.
2.0%
of students plan to live there after college.
20.7%
of students from the Southeast have a relative that went to Harvard College.
13.2%
of students are from the Midwest.
3.1%
of students plan to live there after college.
21.7%
of students from the Midwest have a relative that went to Harvard College.
6.4%
of students are from the Southwest.
1.6%
of students plan to live there after college.
14.3%
of students from the Southwest have a relative that went to Harvard College.
14.8%
of students are from the West.
11.9%
of students plan to live there after college.
33.3%
of students from the West have a relative that went to Harvard College.
14.5%
of students are from outide the US.
9.6%
of students plan to live there after college.
11.8%
of students from outside the US have a relative that went to Harvard College.
Families & Finance
In addition its academic preeminence, Harvard is ranked among the world’s most expensive undergraduate institutions. The total cost of attendance for a Harvard College student enrolled for the current academic year is $69,607 — marking the second year in a row that University administrators have raised tuition faster than the pace of inflation. Roughly 61.1 percent of surveyed students reported receiving financial assistance from Harvard’s need-blind aid program, a moderate bump up from approximately 55.4 percent of aid-receiving respondents last year.
About 14.6 percent of Class of 2023 respondents said they are legacy students, defined as having one or more parents who attended Harvard College as undergraduates; they comprise roughly the same share as legacies among last year’s freshmen.
- 24.6 percent of surveyed freshmen who identified as white also reported being legacy students. Among Hispanic and Latinx respondents, 11.6 percent indicated the same, 9.8 percent of Black and African American respondents did so, and roughly 15.1 percent of those who identified as Asian reported being legacy students.
- Among self-reported legacy students who answered a question about their family income, more than two-thirds indicated their parents make at least a combined $250,000 per year, with 40 percent raking in $500,000 or more. Less than 12 percent of these legacy respondents report a combined parental income of $124,999 or less.
The percentage of survey participants who described themselves as first-generation college students rose again this year — increasing from 17 percent to 18.2 percent.
- 37.5 percent of Hispanic or Latinx respondents indicated they were the first in their families to go to college, as did 21.6 percent of Black and African American students, 15.9 percent of Asian students, and 12.2 percent of white students.
- First-generation freshmen reported much lower family incomes than non-first-generation matriculants in this year’s survey. About 6.7 percent said their parents make a combined $125,000 or more each year, while just over half reported an annual family income of less than $40,000.
- Nearly all first-generation students surveyed — 97.4 percent — said they receive some form of financial aid from Harvard.
The Path to Harvard
Admission to Harvard College was once again the most competitive it’s been in the University’s history; only 4.5 percent of 43,330 applicants secured spots in the Class of 2023. This was the fifth consecutive year that the admission rate has dropped from the cycle before. Admitted students were as eager as ever to stake out a claim on the Charles; 81.7 percent accepted their offers, marking the second-highest matriculation rate in five decades.
- Harvard was the top-choice school for a substantial majority — 72.5 percent — of surveyed freshmen.
- 36.3 percent of respondents applied to Yale as well. Among these students, 44.8 percent were also accepted at Harvard’s New Haven rival.
- Just under 19 percent of respondents reported receiving help preparing college applications from a privately hired counselor. Of these students, 53.4 percent of those who disclosed their parents’ financial status reported a combined family income of $250,000 or more; 4.9 percent reported a parental income of less than $40,000.
- A majority of survey participants — 60.9 percent — said they attended a non-charter public high school, 34 percent indicated they went to a parochial or non-religious private school, and 0.5 percent reported being homeschooled.
- Students who reported legacy status were much more likely to attend a private high school than students who do not have a parent who attended the College.
- 68.5 percent of respondents reported attending secondary schools that reported class rank. Among these students, 75.7 percent said they graduated among the top 2 percent of students in their graduating classes. 60.6 percent of self-reported legacy students at such schools said they were in this top cohort of academic achievers, while 48.9 percent of recruited athletes indicated the same.